Profiling a Slow Vue Screen Before Changing Its Architecture

Selecting a different tool in an inventory changes two row states: the old selection becomes inactive and the new one becomes active. In the first version of this Vue screen, that small action executes the render function of all 4,000 rows.
Filtering has a different problem. Searching for "clamp" reduces the list to 500 rows. Clearing the query restores the other 3,500, with layout work that continues after Vue has finished updating the DOM.
Those symptoms deserve separate measurements. Changing the rendering architecture, adding a store, or splitting another chunk would be an expensive way to avoid finding out which work the interaction actually performs.
Start with One Reproducible Screen
The local example, commands, and results use Vue 3.5.45, TypeScript 6.0.3, and compiled single‑file components in a minified production bundle. The fixed dataset has eight tool families, stable identifiers, branch names, stock counts, and nested name/category details. The measurements come from rendering and filtering those records, without adding an artificial busy loop. You can download the Vue profiling experiment.
Four variants make incremental changes:
| Variant | What changes |
|---|---|
| Baseline | Deep ref data; every row receives the selected identifier. |
| Stable props | Each row receives its own active boolean instead. |
| Shallow data | Stable props remain; the dataset uses shallowRef. |
| Pages | Shallow data and stable props remain; only 50 matching rows are visible. |
The first three expose the same full list. Pagination changes the navigation, which matters when judging its result. All four must return identical matching identifiers, preserve the selected identifier, and apply the same case‑insensitive name, category, and branch filter.
The timings below come from a 16 November 2026 run in headless Chrome 157.0.8103.51 on an Apple M2 with eight logical CPUs and 24 GiB of memory, using macOS 27.0.1 and a 1280 × 900 viewport. There is no CPU or network throttling. This is a shared development machine, not a calibrated device lab; the raw record includes host load averages.
Each page gets three warm‑up cycles. Two measured blocks reverse the variant order, producing twelve samples per variant for selection, narrowing the query to "clamp", and clearing it. The query is replaced as a whole value in one input event, rather than typed character by character. Every interaction finishes before the next begins.
Choose the Timing Boundary Carefully
The first duration runs from the event handler to an awaited nextTick. A second continues through two animation‑frame callbacks:
const start = performance.now();
apply();
await nextTick();
const updateMs = performance.now() - start;
await frame();
await frame();
const settledMs = performance.now() - start;
Here, frame wraps requestAnimationFrame in a Promise. The full implementation also records User Timing marks and flags overlapping samples. It still applies rapid input immediately; instrumentation mustn't discard a user's keystroke because a previous measurement is unfinished.
Vue's nextTick documentation describes a DOM‑update flush. It doesn't promise that the browser has finished layout or presented the pixels. Two frame callbacks provide a later scheduling reference, but still aren't a precise paint timestamp. Neither duration is field INP, and the measurement excludes any input delay before the handler starts.
Keep the two numbers separate. The primary comparison below uses the Vue update duration. Browser traces then show work beyond that boundary.
Stop Changing Every Child's Props
The baseline passes the current selection into every row:
<Row
  v-for="row in visible"
  :key="row.id"
  :row="row"
  :active-id="selectedId"
  @select="select"
/>
Changing selectedId changes that prop for every child. Each child then decides whether the new identifier matches its own row.
The stable‑props variant makes that decision in the parent:
<Row
  v-for="row in visible"
  :key="row.id"
  :row="row"
  :active="row.id === selectedId"
  @select="select"
/>
For 3,998 rows, row and active stay the same. Both versions use the same row component, with a counter to record how often it renders. The counter returns a constant marker; returning the changing count would itself create extra attribute writes and spoil the experiment.
On a selection change, the baseline executes 4,000 row renders. Stable props execute two. That doesn't mean the baseline paints 4,000 rows: Vue can render a child and discover that its output doesn't need changing. It still has to perform that render work.
Vue's performance guide recommends stable props for this reason. The experiment gives the advice a specific scale and a useful limit.
The Improvement Belongs to the Interaction
These are median handler‑to‑DOM‑flush durations in milliseconds, from twelve samples per cell:
| Variant | Select | Narrow | Clear |
|---|---|---|---|
| Baseline | 17.6 | 27.0 | 21.6 |
| Stable props | 3.2 | 26.2 | 21.8 |
| Shallow data | 2.1 | 20.3 | 15.7 |
| Pages | 0.2 | 12.5 | 0.7 |
Stable props make selection noticeably cheaper in this example. Its observed update range moves from 15.8–19.5 ms to 2.8–4.1 ms. Narrowing barely changes: 25.0–31.3 ms becomes 24.3–27.7 ms. The filtering computation still runs once, and the browser still has to remove the excluded rows.
That negative result is useful. A change can be correct, measurable, and largely irrelevant to the interaction someone complained about.
I kept the raw samples and minimum–maximum ranges with the benchmark results. A small counter‑disabled check retains the selection difference: median 17.6 ms for the baseline and 3.1 ms for stable props, with three samples each. The timing helpers themselves still add some work.
The later two‑frame selection medians are about 30 ms for both versions despite their different Vue update costs. Frame scheduling can obscure a substantial reduction in work. Using that proxy alone would make the two implementations look much more similar than their execution paths are.
Shallow Data Changes How You Update a Row
The inventory arrives as a snapshot. That makes shallow reactivity worth testing: Vue can observe replacement of the root value without deeply converting the objects inside it.
In this workload, shallow data reduces the measured narrowing computation from 15.2 ms in the stable‑props variant to 11.0 ms. The overall narrowing update falls to 20.3 ms. These numbers include the actual filter's string work; they don't isolate a universal price for a Proxy.
The shallow reactivity API changes what updates the view. Mutating rows.value[0].details.name alone doesn't notify through a shallow ref. The correctness suite checks that behaviour against actual Vue: deep‑ref mutation updates the row, shallow mutation alone does not.
When changing one record, replace its identity and the changed nested object as well as the array. The test constructs its replacement like this:
const next = rows.map(row => row.id === 'tool-0001'
  ? { ...row, details: { ...row.details, name: 'Replacement clamp' } }
  : row);
await api.replaceRows(next);
The example's update method assigns rows.value = next. Simply copying the array after mutating a shared raw row can leave that child's row prop unchanged. Stable props then make the mistake rather efficiently: the child has no changed prop telling it to render.
If your application edits nested values in place, replacing each object like this may be more trouble than it's worth. Keep the distinction from the broader Vue reactivity explanation and Composition API ownership patterns in view. A faster result isn't much help if the way you edit a record no longer updates the screen.
Clearing the Query Reveals the DOM Cost
Narrowing and clearing are not interchangeable samples. The non‑empty query scans the fields; the empty query returns the full array directly. Clearing also recreates 3,500 rows in the full‑list versions.
The baseline's median Vue update finishes after 21.6 ms, but its two‑frame interval reaches 71.3 ms. The graph shows those separate boundaries and their observed ranges:
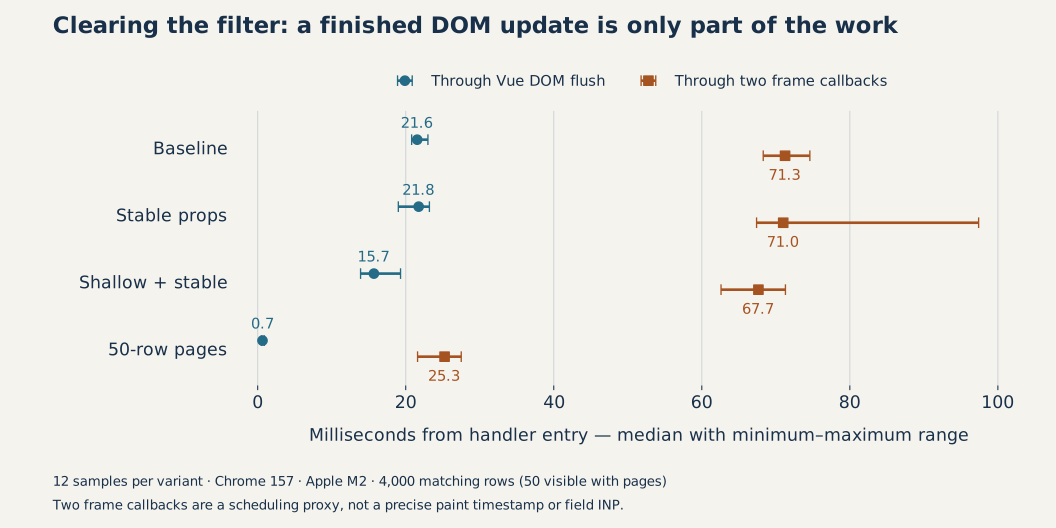
The Chrome traces were recorded in separate runs so that tracing overhead couldn't enter the repeated timings. User Timing marks identify each interaction; the analysis selects their renderer main thread and measures only the marked interval.
In the representative clearing trace, baseline layout takes about 30.8 ms. The paginated trace records about 0.54 ms. Those figures each come from one trace, rather than a median of twelve runs. Event durations can also overlap: adding RunTask, function calls, layout, and paint into a total would count some work twice. Function‑call events alone don't capture all JavaScript work, including Vue's microtask flush.
The trace supports a specific next step: reduce the amount of visible DOM if the interaction can tolerate it. It doesn't establish that Vue needs replacing.
Pagination Changes the Experience Too
Fifty‑row pages reduce the parent's rendering work and the number of elements the browser must lay out. They don't reduce this client‑side filter to fifty records. It still searches all 4,000, which is why the paginated narrowing update remains around 12.5 ms whilst clearing is much cheaper.
The native page buttons stay mounted and focusable when unavailable, with aria-disabled and a matching click guard. Reaching the final page doesn't remove the button beneath keyboard focus. A 51‑row browser case reaches the last record, selects it with Space, and confirms that a new query returns to page one whilst focus stays in the search field. Completed changes update a persistent status region. Screen‑reader speech wasn't measured.
Pagination suits a tool lookup where someone searches and selects a result. It may be unsuitable when the task requires scanning a continuous list, comparing distant records, or using browser find across every item. Virtualisation could preserve a scrolling interaction, but it brings its own focus, item‑height, and navigation decisions. I haven't measured a virtualised version here, so I can't compare its performance with the paginated version.
Keep Delivery and Update Work Separate
All the measured warm interactions make no new resource requests. The example is already loaded. Route‑level lazy loading and code splitting remain useful for delivery, but splitting an unrelated route can't remove these 4,000 row renders from an already‑open screen.
Mount observations are retained separately: there are only two per variant, and they begin when the example calls mount. They exclude downloading and parsing the bundle, so they are not page‑load benchmarks. The experiment doesn't compare SSR, hydration strategies, mobile hardware, or production user populations.
For a real regression, keep the reproducible interaction alongside field evidence and an agreed performance budget. The lab helps explain where the work goes; field measurements establish which users experience a problem and how often.
Here, the next changes are modest. Stable props remove unnecessary selection work. Shallow data helps if replacing records fits the way you update the inventory. Pagination addresses the expensive full‑list restoration if the navigation suits the task. None requires a new application architecture, and each has a test showing what it actually changes.