Building and Testing Accessible React Charts

South's revenue report for 2 November is missing. North's report for 3 November says £0.00. Those are different facts, and both need to survive every representation of the chart.
In this example, the reader wants to compare daily net revenue between two branches, inspect refunds, and establish how much data has actually arrived. Someone reading the table should be able to obtain the same answers as someone looking at the bars. That sounds straightforward until the table has its own filtering code, the summary treats a missing value as zero, and the tooltip rounds differently from both.
I'd settle how those values are handled before choosing a charting library. Otherwise, we can end up with several convincing‑looking versions of the same report, all saying something slightly different.
Define the Awkward Values First
Here is the complete input for the example. Amounts are integer pence, dates identify calendar days, and null means that a report hasn't arrived.
| Date | Branch | Pence | Meaning |
|---|---|---|---|
| 2026‑11‑01 | North | 12345 | £123.45 |
| 2026‑11‑01 | South | 8900 | £89.00 |
| 2026‑11‑02 | North | ‑2345 | Net refunds of £23.45 |
| 2026‑11‑02 | South | null | Not reported |
| 2026‑11‑03 | North | 0 | Reported revenue of £0.00 |
| 2026‑11‑03 | South | 101 | £1.01 |
The known total is £190.01, with five of six rows reported. North contributes £100.00 from three reports. South contributes £90.01 from two, with one missing. Calling South's number its complete revenue would imply something the data doesn't establish.
The input validator rejects fractional pence, unsafe integers, invalid calendar dates, and duplicate branch/date pairs. Two branches can report for the same day; one branch cannot silently submit two competing values for that day. Corrections need to replace a report through a defined process, rather than accidentally adding its revenue twice.
Dates remain date‑only strings. Converting a calendar day into a midnight timestamp and then formatting it in the user's time zone can change the displayed day. If your source contains transactions rather than daily reports, aggregate them using the business's agreed time zone before passing them into this model. That is a different operation from labelling a bar.
Give Every View the Same Rows
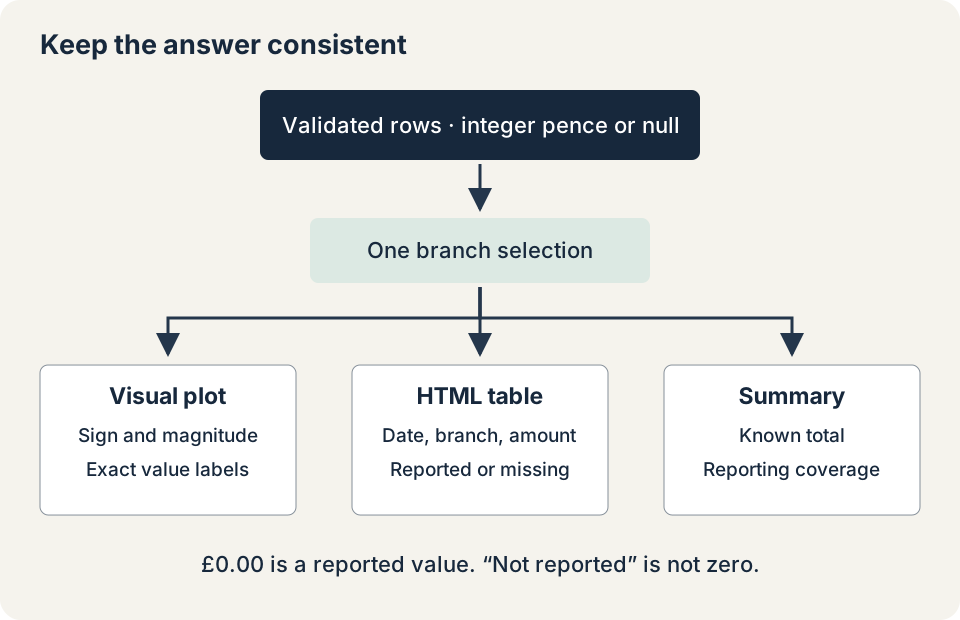
The model normalises the input, applies the selected branch, calculates reporting coverage, and formats each value. React receives one result from which to render the plot, table, and visible summary.
export type RevenueInput = Readonly<{
  branch: 'North' | 'South';
  date: string;
  pence: number | null;
}>;

export type RevenueRow = RevenueInput & Readonly<{
  id: string;
  label: string;
  valueText: string;
}>;
The stable identifier combines branch and date. The display label contains both, and valueText is either an exact currency amount or "Not reported". The plot and table both use that label, so a missing report means the same thing in either view.
The formatting function uses integer arithmetic. It separates pounds and pence without first converting the amount into a floating‑point number of pounds:
export const formatPence = (pence: number): string => {
  if (!Number.isSafeInteger(pence)) {
    throw new RangeError('Pence must be a safe integer');
  }
  const amount = BigInt(pence);
  const magnitude = amount < 0n ? -amount : amount;
  return `${amount < 0n ? '-' : ''}£${
    (magnitude / 100n).toLocaleString('en-GB')
  }.${String(magnitude % 100n).padStart(2, '0')}`;
};
This is a pounds‑sterling formatter for the example, not a general international currency library. It deliberately rejects amounts that have already lost integer precision. Summation also uses BigInt and checks that the result fits the model's supported range before converting back. A chart shouldn't quietly approve a total simply because each individual input looked reasonable.
There is no rounding decision left to make at rendering time: one penny remains one penny. If a product displays thousands or millions, centralise that rounding rule too, and make exact amounts available without requiring a hover.
Make the Plot Useful Without Making It Compulsory
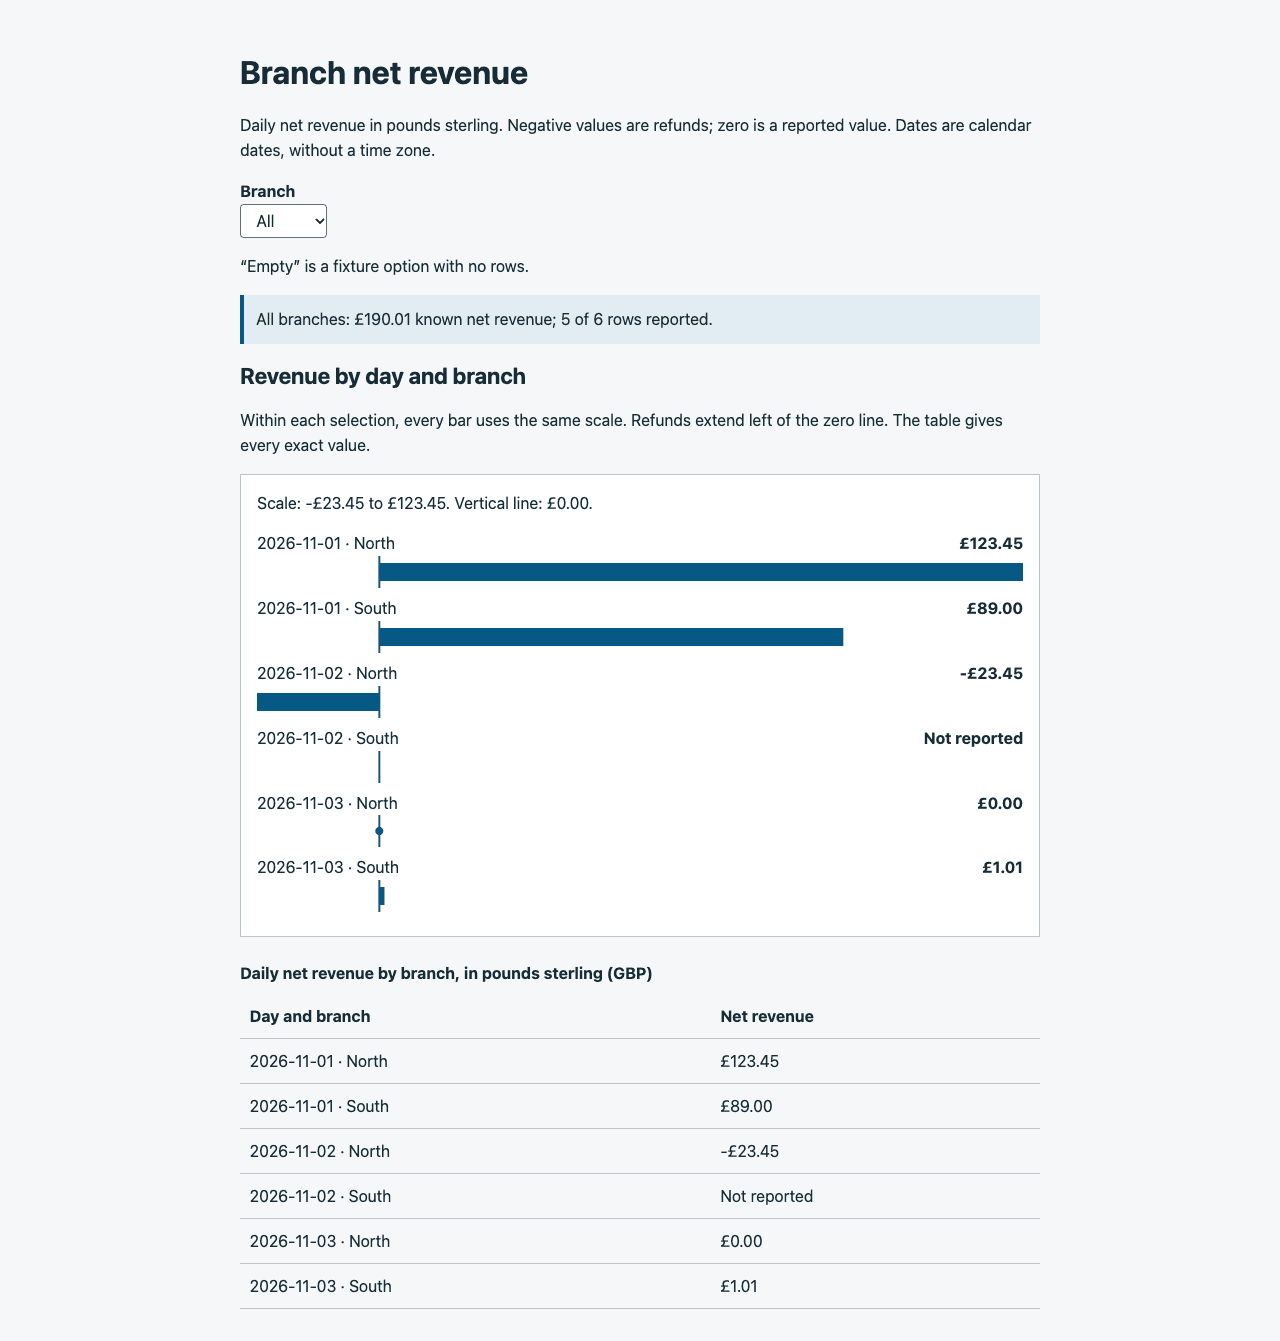
For these six reports, a horizontal bar plot is enough. Negative amounts extend left of a shared zero baseline, positive amounts extend right, and a measured zero has a dot. A missing report has its label but no bar or zero marker.
The same colour is used for every amount. Direction, printed signs, and exact labels carry the meaning. A red bar would not make a refund more understandable to someone who cannot distinguish the colour.
View the chart and table at full size
The bars share a scale within the current selection. Filtering recalculates that scale and prints its bounds. Use the "All" view to compare branches directly; equal pixel lengths in two separately filtered views don't necessarily represent equal revenue. A fixed domain across selections is another reasonable choice when retaining visual comparisons matters more than filling the available width.
Every value is also present in an ordinary visible table:
<table>
  <caption>Daily net revenue by branch, in pounds sterling (GBP)</caption>
  <thead>
    <tr>
      <th scope="col">Day and branch</th>
      <th scope="col">Net revenue</th>
    </tr>
  </thead>
  <tbody>
    {model.rows.map(row => (
      <tr key={row.id}>
        <th scope="row">{row.label}</th>
        <td>{row.valueText}</td>
      </tr>
    ))}
  </tbody>
</table>
Because the table and explanatory text already provide this information, the visual plot is hidden from the accessibility tree. Its SVG elements aren't focusable. There is no chart‑only action, tooltip‑only value, or drag‑only filter to lose: the labelled native select controls the same data for everyone. The visible explanatory text and table expose the meaning independently of the bars.
This choice fits a small, non‑interactive plot. Hiding an interactive chart and supplying a table would be inadequate if the table omitted its drill‑down action, time‑range control, or essential trend information. W3C's guidance on complex images distinguishes identifying a chart from providing the information it communicates. A table supplies exact values; it doesn't automatically describe a complicated relationship that the visualisation makes apparent.
Nor does this example mean chart libraries lack keyboard support. Recharts enabled its accessibility layer by default in version 3.0, and MUI documents chart keyboard navigation. For a larger interactive chart, those facilities may be a better starting point. You'll still need to check that people can get the information they came for.
Leave Focus Where the Reader is Working
Changing the branch keeps focus on the select. The chart and table update beneath it. Moving focus into the first row would make comparing another branch more work, and focusing the summary just to make it speak would confuse navigation with notification.
A status region exists empty from the initial render. The selection handler updates it with the new summary:
<p role="status" aria-atomic="true" className="visually-hidden">
  {announcement}
</p>
Only the deliberate filter change sets announcement. Rendering the component again doesn't announce the entire dataset. The fuller reasoning is in announcing dynamic updates with live regions; the important point here is to choose an update that helps the reader finish this particular task.
The example accepts replacement rows without resetting the selected branch or moving focus. It deliberately doesn't announce those replacements automatically. There is no background poller in this small screen. If a product adds live reports, it needs an explicit policy for telling readers that fresh data is available, allowing them to inspect it without a stream of interruptions. Announcing the filter message every time a report arrives would soon get in the way.
The visible summary always describes the current data. The separate live message describes the most recent explicit selection, so it mustn't be presented as a second current summary. Keeping that distinction clear also makes it easier to test.
Make the Tests Capable of Catching Disagreement
A test that calculates its expected total using the same function as the chart can preserve the same bug twice. The model tests therefore start with hand‑calculated answers: 19,001 pence overall, 10,000 for North, and 9,001 for South. Separate cases cover all‑missing data, an empty selection, a single negative amount, and all‑zero values.
The browser test checks more than the presence of an SVG. After every filter, it compares row identifiers, labels, exact amounts, and missing markers between the expected dataset, model, table, and plot. It checks that refund bars end at zero from the left, positive bars start at zero, and only a measured zero receives the dot.
A controlled data replacement fills South's missing report with £5.00. The expected known total becomes £95.01 for South, with all three reports available. The component test verifies the changed table cell and plot, the retained selection and focus, and the absence of an unsolicited live‑message update.
The local example and test commands use React 19.3.1 and TypeScript 6.0.3. All 25 Jest model and component tests passed. A separate Chrome 157 suite checked the displayed data, bar positions, focus, and changes to the status message. For the keyboard checks, I used Tab, then the select's native type‑ahead and Enter. You can download the chart example and tests.
Labels and table text remain ordinary HTML at a readable text size, rather than shrinking inside an SVG view box. The 390‑pixel layout passed the overflow check. A separate 200% CSS zoom simulation exercised constrained layout, but that is not a substitute for checking the browser's own zoom controls.
Finish with the Actual Reading Task
The browser tests can tell us that the status text changed once. They can't tell us whether a screen reader announced it clearly, at the right time, or more than once.
Here's the check I'd make next with VoiceOver in Safari and NVDA in Firefox: select South, find its missing report, and read the £90.01 known total and the number of reports included. Then return to All and find the refund and the reported zero. Record the operating system, browser and screen‑reader versions, the wording heard, and focus before and after selection. I haven't yet tested this example with those browser and screen‑reader combinations.
I'd complete that check before using this implementation in a product. It may reveal an awkward table announcement or a redundant message that a structural assertion cannot judge. The general principle from accessible reusable components applies here too: verify the assembled interaction, not just the individual elements.
A chart has done its job when readers can answer the question accurately, whichever representation they use. For this report, that means keeping missing values distinct from zero and showing the same amounts in the table, summary, and bars.